
one step
[Python] 문장 분석 전처리하고 word cloud 만들기 본문
트럼프 대통령 트윗 분석하기
첫 번째 프로젝트에서는 트럼프 대통령이 2017년 1월 20일 취임 이후 1년 동안 게시한 2,500여 개의 트윗을 분석해봅니다.
가장 많이 사용한 #해시태그
가장 많이 사용한 키워드
가장 많이 사용한 @멘션
월별 트윗 통계
분석 후, 데이터의 유형에 알맞은 시각화 코드를 살펴봅니다.
막대 그래프
단어 구름
코드를 작성하기 전에 tweets.py 파일과 main.py의 스켈레톤 코드를 살펴보세요.
작성해야 하는 함수
preprocess_text(text)
analyze_text(words)
filter_by_month(tweet_data, month)
세부 구현 사항
1. preprocess_text(text)
문자열 text를 가공하여 반환합니다.
모든 알파벳 대문자를 알파벳 소문자로 변경합니다.
특수문자를 삭제합니다.
가공된 텍스트를 공백을 기준으로 나누어 리스트 형태로 반환합니다.
호출 예시
preprocess_text("On my way! #Inauguration2017 https://t.co/hOuMbxGnpe")
Copy
반환 예시
['on', 'my', 'way', '#inauguration2017', 'httpstcohoumbxgnpe']
Copy
2. analyze_text(words)
문자열을 담고 있는 words 리스트가 주어집니다.
각각의 원소는 모두 keywords리스트에 저장하되, 단어가 @나 #로 시작한다면 첫 번째 글자는 제거하여 저장합니다. (예 : #tweet는 tweet의 값으로 저장한다.)
# 문자로 시작하는 원소는 hashtags 리스트에, @문자로 시작하는 원소는 mentions 리스트에 각각 첫 번째 문자(#, @)를 제거하고 저장합니다.
함수는 keywords, hashtags, mentions 를 반환해야 합니다.
반환 결과에서 첫 번째 리스트는 모든 키워드, 두 번째 리스트는 해쉬태그 키워드, 세 번째 리스트는 멘션 키워드를 갖고 있습니다.
호출 예시
analyze_text(['on', 'my', 'way', '#inauguration2017', 'httpstcohoumbxgnpe'])
Copy
반환 예시
(['on', 'my', 'way', 'inauguration2017', 'httpstcohoumbxgnpe'], ['inauguration2017'], [])
Copy
3. filter_by_month(tweet_data, month)
트윗 데이터와 트윗이 작성된 월(정수)을 입력 받아 해당 월에 게시된 트윗을 리스트에 저장한 후, 반환합니다.
호출 예시
filter_by_month(tweet_data, month)에서
tweet_data = [('01-19-2017 20:13:57', 'On my way! #Inauguration2017 https://t.co/hOuMbxGnpe'), ('02-01-2017 00:31:08', 'Getting ready to deliver a VERY IMPORTANT DECISION! 8:00 P.M.'), ('03-03-2017 02:27:29', '...intentional. This whole narrative is a way of saving face for Democrats losing an election that everyone thought they were supposed.....'), ('03-03-2017 02:35:33', '...to win. The Democrats are overplaying their hand. They lost the election and now they have lost their grip on reality. The real story...')]
month = 3
Copy
인 상태로 호출한 결과는 다음과 같습니다.
반환 예시
['...intentional. This whole narrative is a way of saving face for Democrats losing an election that everyone thought they were supposed.....', '...to win. The Democrats are overplaying their hand. They lost the election and now they have lost their grip on reality. The real story...']
Copy
전체 트윗 데이터 중 3월에 작성한 트윗의 내용을 리스트에 담아 반환했습니다.
# 초기코드
# 트럼프 대통령의 트윗 모음을 불러옵니다.
from tweets import trump_tweets

# 그래프에 필요한 라이브러리를 불러옵니다.
import matplotlib.pyplot as plt

# 단어구름에 필요한 라이브러리를 불러옵니다.
import numpy as np
from PIL import Image
from wordcloud import WordCloud

# 특화된 컨테이너 모듈에서 수 세기를 돕는 메소드를 불러옵니다.
from collections import Counter

# 문자열 모듈에서 특수문자를 처리를 돕는 메소드를 불러옵니다.
from string import punctuation

# 엘리스에서 파일 송출에 필요한 패키지를 불러옵니다.
from elice_utils import EliceUtils
elice_utils = EliceUtils()


# 데이터 전처리를 실행합니다.
def preprocess_text(text):
    # 분석을 위해 text를 모두 소문자로 변환합니다.
    text = text.lower()

    # @와 #을 제외한 특수문자로 이루어진 문자열 symbols를 만듭니다.
    symbols = punctuation.replace('@', '').replace('#', '')

    return []


# 해시태그와 키워드를 추출합니다.
def analyze_text(words):
    # 키워드, 해시태그, 멘션을 저장할 리스트를 각각 생성합니다.
    keywords, hashtags, mentions = [], [], []


    return keywords, hashtags, mentions


def filter_by_month(tweet_data, month):
    # month를 문자열로 바꾼 month_string을 선언합니다.
    # 이 때 한 자리 수는 앞에 '0'을 넣어줍니다. (ex: 1 => '01')
    month_string = '0' + str(month) if month < 10 else str(month)

    # 선택한 달의 트윗을 filtered_tweets에 저장합니다.
    filtered_tweets = []

    # 트윗의 날짜가 선택한 달에 속해 있으면 트윗의 내용을 filtered_tweets에 추가합니다.


# 트윗 통계를 출력합니다.
def show_stats():
    keyword_counter = Counter()
    hashtag_counter = Counter()
    mention_counter = Counter()

    for _, tweet in trump_tweets:
        keyward, hashtag, mention = analyze_text(preprocess_text(tweet))
        keyword_counter += Counter(keyward)
        hashtag_counter += Counter(hashtag)
        mention_counter += Counter(mention)

    # 가장 많이 등장한 키워드, 해시태그, 멘션을 출력합니다.
    top_ten = hashtag_counter.most_common(10)
    for hashtag, freq in top_ten:
        print('{}: {}회'.format(hashtag, freq))


# 월 별 트윗 개수를 보여주는 그래프를 출력합니다.
def show_tweets_by_month():
    months = range(1, 13)
    num_tweets = [len(filter_by_month(trump_tweets, month)) for month in months]

    plt.bar(months, num_tweets, align='center')
    plt.xticks(months, months)

    plt.savefig('graph.png')
    elice_utils = EliceUtils()
    elice_utils.send_image('graph.png')


# wordcloud 패키지를 이용해 트럼프 대통령 실루엣 모양의 단어구름을 생성합니다.
def create_word_cloud():

    counter = Counter()
    for _, tweet in trump_tweets:
        keywords, _, _ = analyze_text(preprocess_text(tweet))
        counter += Counter(keywords)

    trump_mask = np.array(Image.open('trump.png'))
    cloud = WordCloud(background_color='white', mask=trump_mask)
    cloud.fit_words(counter)
    cloud.to_file('cloud.png')
    elice_utils.send_image('cloud.png')


# 입력값에 따라 출력할 결과를 선택합니다.
def main(code=1):
    # 가장 많이 등장한 키워드, 해시태그, 멘션을 출력합니다.
    if code == 1:
        show_stats()

    # 트럼프 대통령의 월별 트윗 개수 그래프를 출력합니다.
    if code == 2:
        show_tweets_by_month()

    # 트럼프 대통령의 트윗 키워드로 단어구름을 그립니다.
    if code == 3:
        create_word_cloud()


# main 함수를 실행합니다.
if __name__ == '__main__':
    main(3)
# 트럼프 대통령의 트윗 모음을 불러옵니다.
from tweets import trump_tweets

# 그래프에 필요한 라이브러리를 불러옵니다.
import matplotlib.pyplot as plt

# 단어구름에 필요한 라이브러리를 불러옵니다.
import numpy as np
from PIL import Image
from wordcloud import WordCloud

# 특화된 컨테이너 모듈에서 수 세기를 돕는 메소드를 불러옵니다.
from collections import Counter

# 문자열 모듈에서 특수문자를 처리를 돕는 메소드를 불러옵니다.
from string import punctuation

# 엘리스에서 파일 송출에 필요한 패키지를 불러옵니다.
from elice_utils import EliceUtils
elice_utils = EliceUtils()


# 데이터 전처리를 실행합니다.
def preprocess_text(text):
    # 분석을 위해 text를 모두 소문자로 변환합니다.
    text = text.lower()

    # @와 #을 제외한 특수문자로 이루어진 문자열 symbols를 만듭니다.
    symbols = punctuation.replace('@', '').replace('#', '')
    #print('symbols:', symbols)
    #symbols: !"$%&'()*+,-./:;<=>?[\]^_`{|}~

    for symbol in symbols:
        text = text.replace(symbol, '')
    text = text.split()
    #print(text)

    return text

# 해시태그와 키워드를 추출합니다.
def analyze_text(words):
    # 키워드, 해시태그, 멘션을 저장할 리스트를 각각 생성합니다.
    keywords, hashtags, mentions = [], [], []

    for word in words:
        if( word.startswith('#') ):
            hashtags.append(word.replace('#',''))
            keywords.append(word.replace('#',''))
        elif( word.startswith('@') ):
            mentions.append(word.replace('@',''))
            keywords.append(word.replace('@',''))
        else:
            keywords.append(word)


    return keywords, hashtags, mentions


def filter_by_month(tweet_data, month):
    # month를 문자열로 바꾼 month_string을 선언합니다.
    # 이 때 한 자리 수는 앞에 '0'을 넣어줍니다. (ex: 1 => '01')
    month_string = '0' + str(month) if month < 10 else str(month)

    # 선택한 달의 트윗을 filtered_tweets에 저장합니다.
    filtered_tweets = []

    # 트윗의 날짜가 선택한 달에 속해 있으면 트윗의 내용을 filtered_tweets에 추가합니다.
    for tweet in tweet_data:
        if( tweet[0].startswith(month_string) ):
            filtered_tweets.append(tweet[1])


    return filtered_tweets


# 트윗 통계를 출력합니다.
def show_stats():
    keyword_counter = Counter()
    hashtag_counter = Counter()
    mention_counter = Counter()

    for _, tweet in trump_tweets:
        keyward, hashtag, mention = analyze_text(preprocess_text(tweet))
        keyword_counter += Counter(keyward)
        hashtag_counter += Counter(hashtag)
        mention_counter += Counter(mention)

    # 가장 많이 등장한 키워드, 해시태그, 멘션을 출력합니다.
    top_ten = hashtag_counter.most_common(10)
    for hashtag, freq in top_ten:
        print('{}: {}회'.format(hashtag, freq))


# 월 별 트윗 개수를 보여주는 그래프를 출력합니다.
def show_tweets_by_month():
    months = range(1, 13)
    num_tweets = [len(filter_by_month(trump_tweets, month)) for month in months]

    plt.bar(months, num_tweets, align='center')
    plt.xticks(months, months)

    plt.savefig('graph.png')
    elice_utils = EliceUtils()
    elice_utils.send_image('graph.png')


# wordcloud 패키지를 이용해 트럼프 대통령 실루엣 모양의 단어구름을 생성합니다.
def create_word_cloud():

    counter = Counter()
    for _, tweet in trump_tweets:
        keywords, _, _ = analyze_text(preprocess_text(tweet))
        counter += Counter(keywords)

    trump_mask = np.array(Image.open('trump.png'))
    cloud = WordCloud(background_color='white', mask=trump_mask)
    cloud.fit_words(counter)
    cloud.to_file('cloud.png')
    elice_utils.send_image('cloud.png')


# 입력값에 따라 출력할 결과를 선택합니다.
def main(code=1):
    # 가장 많이 등장한 키워드, 해시태그, 멘션을 출력합니다.
    if code == 1:
        show_stats()

    # 트럼프 대통령의 월별 트윗 개수 그래프를 출력합니다.
    if code == 2:
        show_tweets_by_month()

    # 트럼프 대통령의 트윗 키워드로 단어구름을 그립니다.
    if code == 3:
        create_word_cloud()


# main 함수를 실행합니다.
if __name__ == '__main__':
    main(3)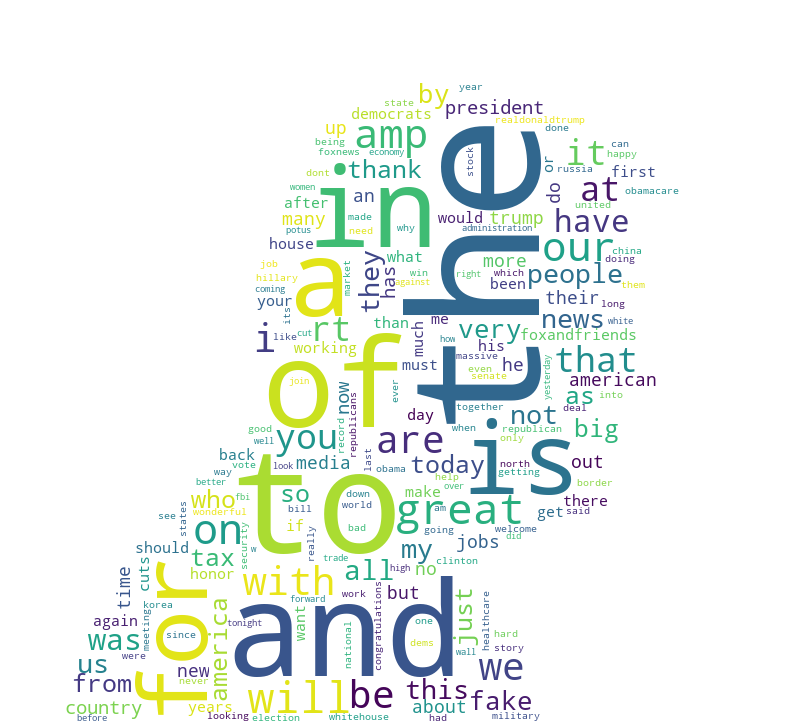
'이것저것 코드 > 파이썬' 카테고리의 다른 글
| [Python] 파이썬 데이터 분석 기초 시험문제 풀이 (트럼프 대통령 트윗 분류하기) (1) | 2022.10.08 |
|---|---|
| [Python] 영어 단어 모음 분석하기 (1) | 2022.10.08 |
| [파이썬] 텍스트와 텍스트의 반복 수 조합해 딕셔너리 만들기 (0) | 2022.09.16 |
| [파이썬] 태그 수집, 중복 태그 수 세어 딕셔너리형으로 반환하기 (0) | 2022.09.16 |
| [파이썬] webdrive 메서드와 url 매개변수가 다른 함수에 있을 때 (0) | 2022.09.16 |

